Remote sensing for urban decisions
Greenness, Temperature & Equity - made actionable
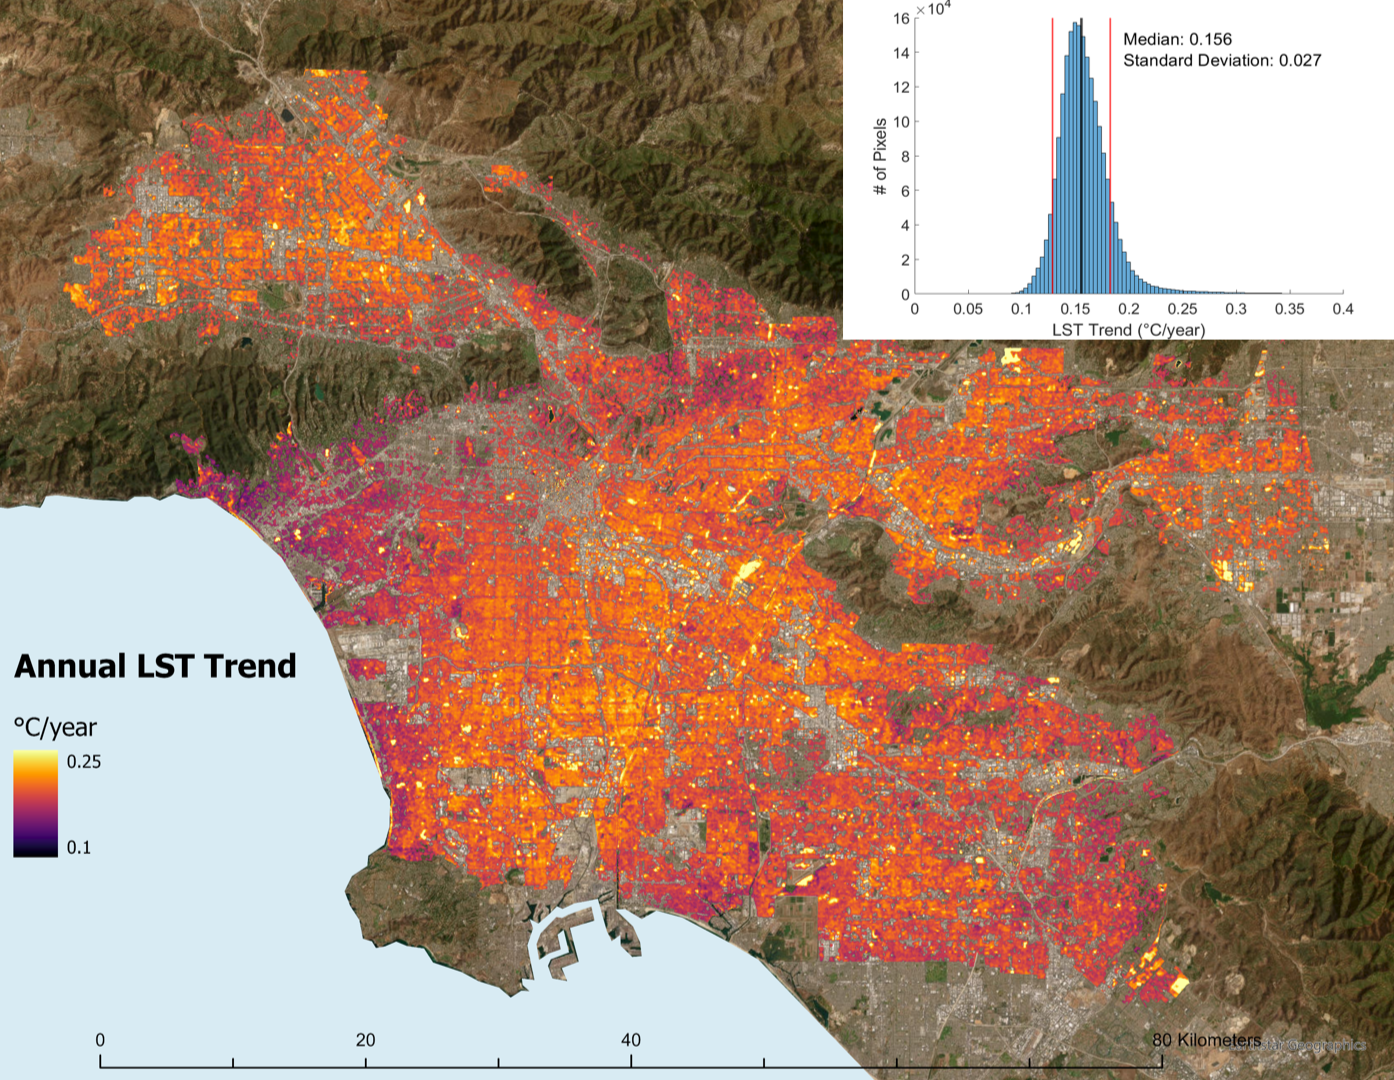
Greater Los Angeles, CA surface temperature trend 1985-2021 at 30-meters resolution.


Describe important details like price, value, length of service, and why it’s unique. Or use these sections to showcase different key values of your products or services.
– Landsat trend & vegetative cooling diagnostics
– Drivers (canopy, impervious, water balance)
– Maps + brief + code

Describe important details like price, value, length of service, and why it’s unique. Or use these sections to showcase different key values of your products or services.
Selected Case Studies

El Paso Tree Prioritization
-
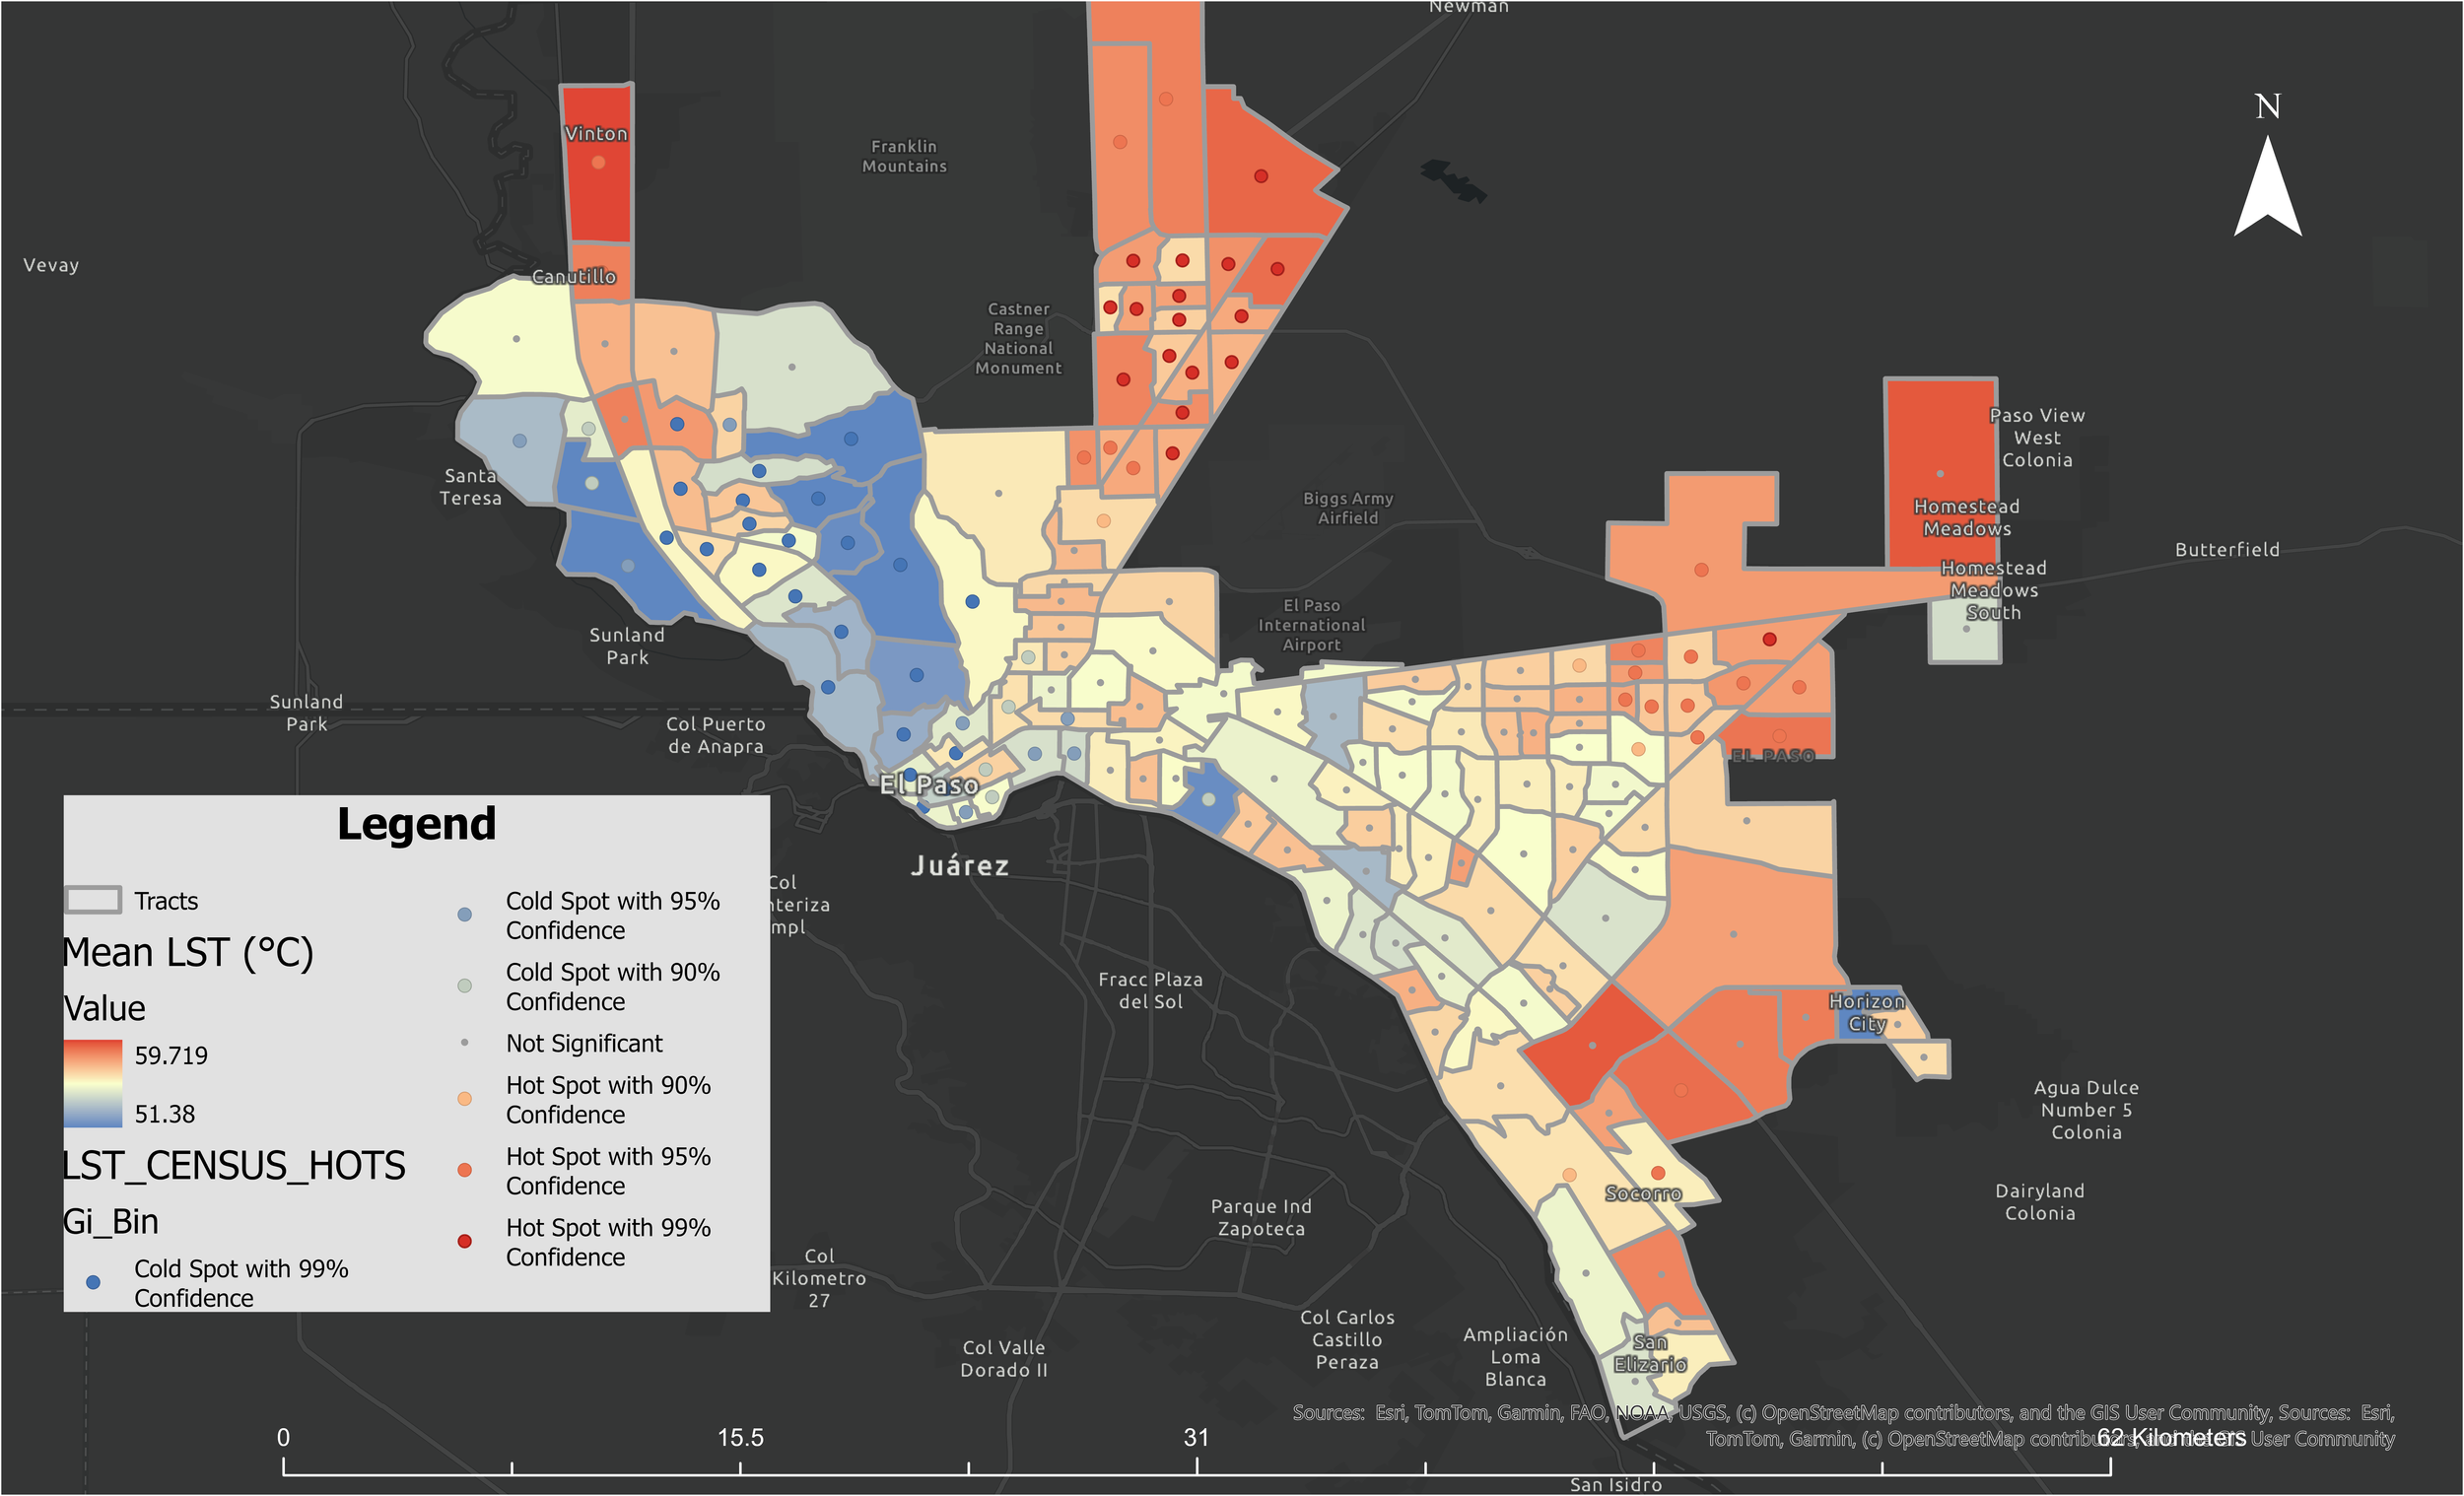
Built a priority index at both census-tract and parcel scales that blends equity (income, race/ethnicity, tenure) with biophysical heat (LST, impervious, canopy, NDVI).
Uses three variants—additive (cardinal), rank/ordinal, and multiplicative—to surface consensus hotspots and reveal trade-offs.
Introduced stakeholder-tunable weights so the City can compare Equity-first, Heat-first, and Balanced scenarios.
Integrated sub-meter imagery to pinpoint parcels where trees are most likely to cool and survive (feasibility mask).
Early patterns: high-heat, low-canopy corridors align with historically underserved blocks; parcel-level screening removes no-plant zones before field work.
-
Deliverables (1–2 weeks): tract/parcel priority maps, ranked lists with indicator scores, scenario workbook (adjust weights), 8–10 pp brief, and reproducible GEE/Python code.
Data needs: open imagery + Census/ACS; optional local tree inventories/ROW constraints if available.
Use it for: grant targeting, capital planning, and community engagement sessions with defensible, transparent scoring.

Global Urban Ecology Analysis (311 cities; 1990-2024)
-
Across 311 cities, vegetative cooling is weakening—~73% show a significant decline in the LST–NDVI cooling slope.
Warming is widespread; NDVI trends are mixed, with the largest marginal cooling gains when greening low-NDVI areas.
Built volume, elevation, and albedo dominate city-to-city differences; changing UHI intensity and water stress shape trends over time.
Practical takeaway: prioritize greening in low-NDVI corridors, and pair canopy with water management in dry climates to maintain cooling benefits.
-
Deliverables (1–2 weeks): your city’s 1990–present benchmarks (NDVI/LST/cooling), driver diagnostics, and a where-to-green-first map, plus a short policy brief and reproducible code.
Comparative lens: shows how your city stacks up against the global sample and what levers (canopy, form, water) move cooling the most in your context.

Los Angeles Urban Area Greenness/Temperature Study (1990-2021)
-
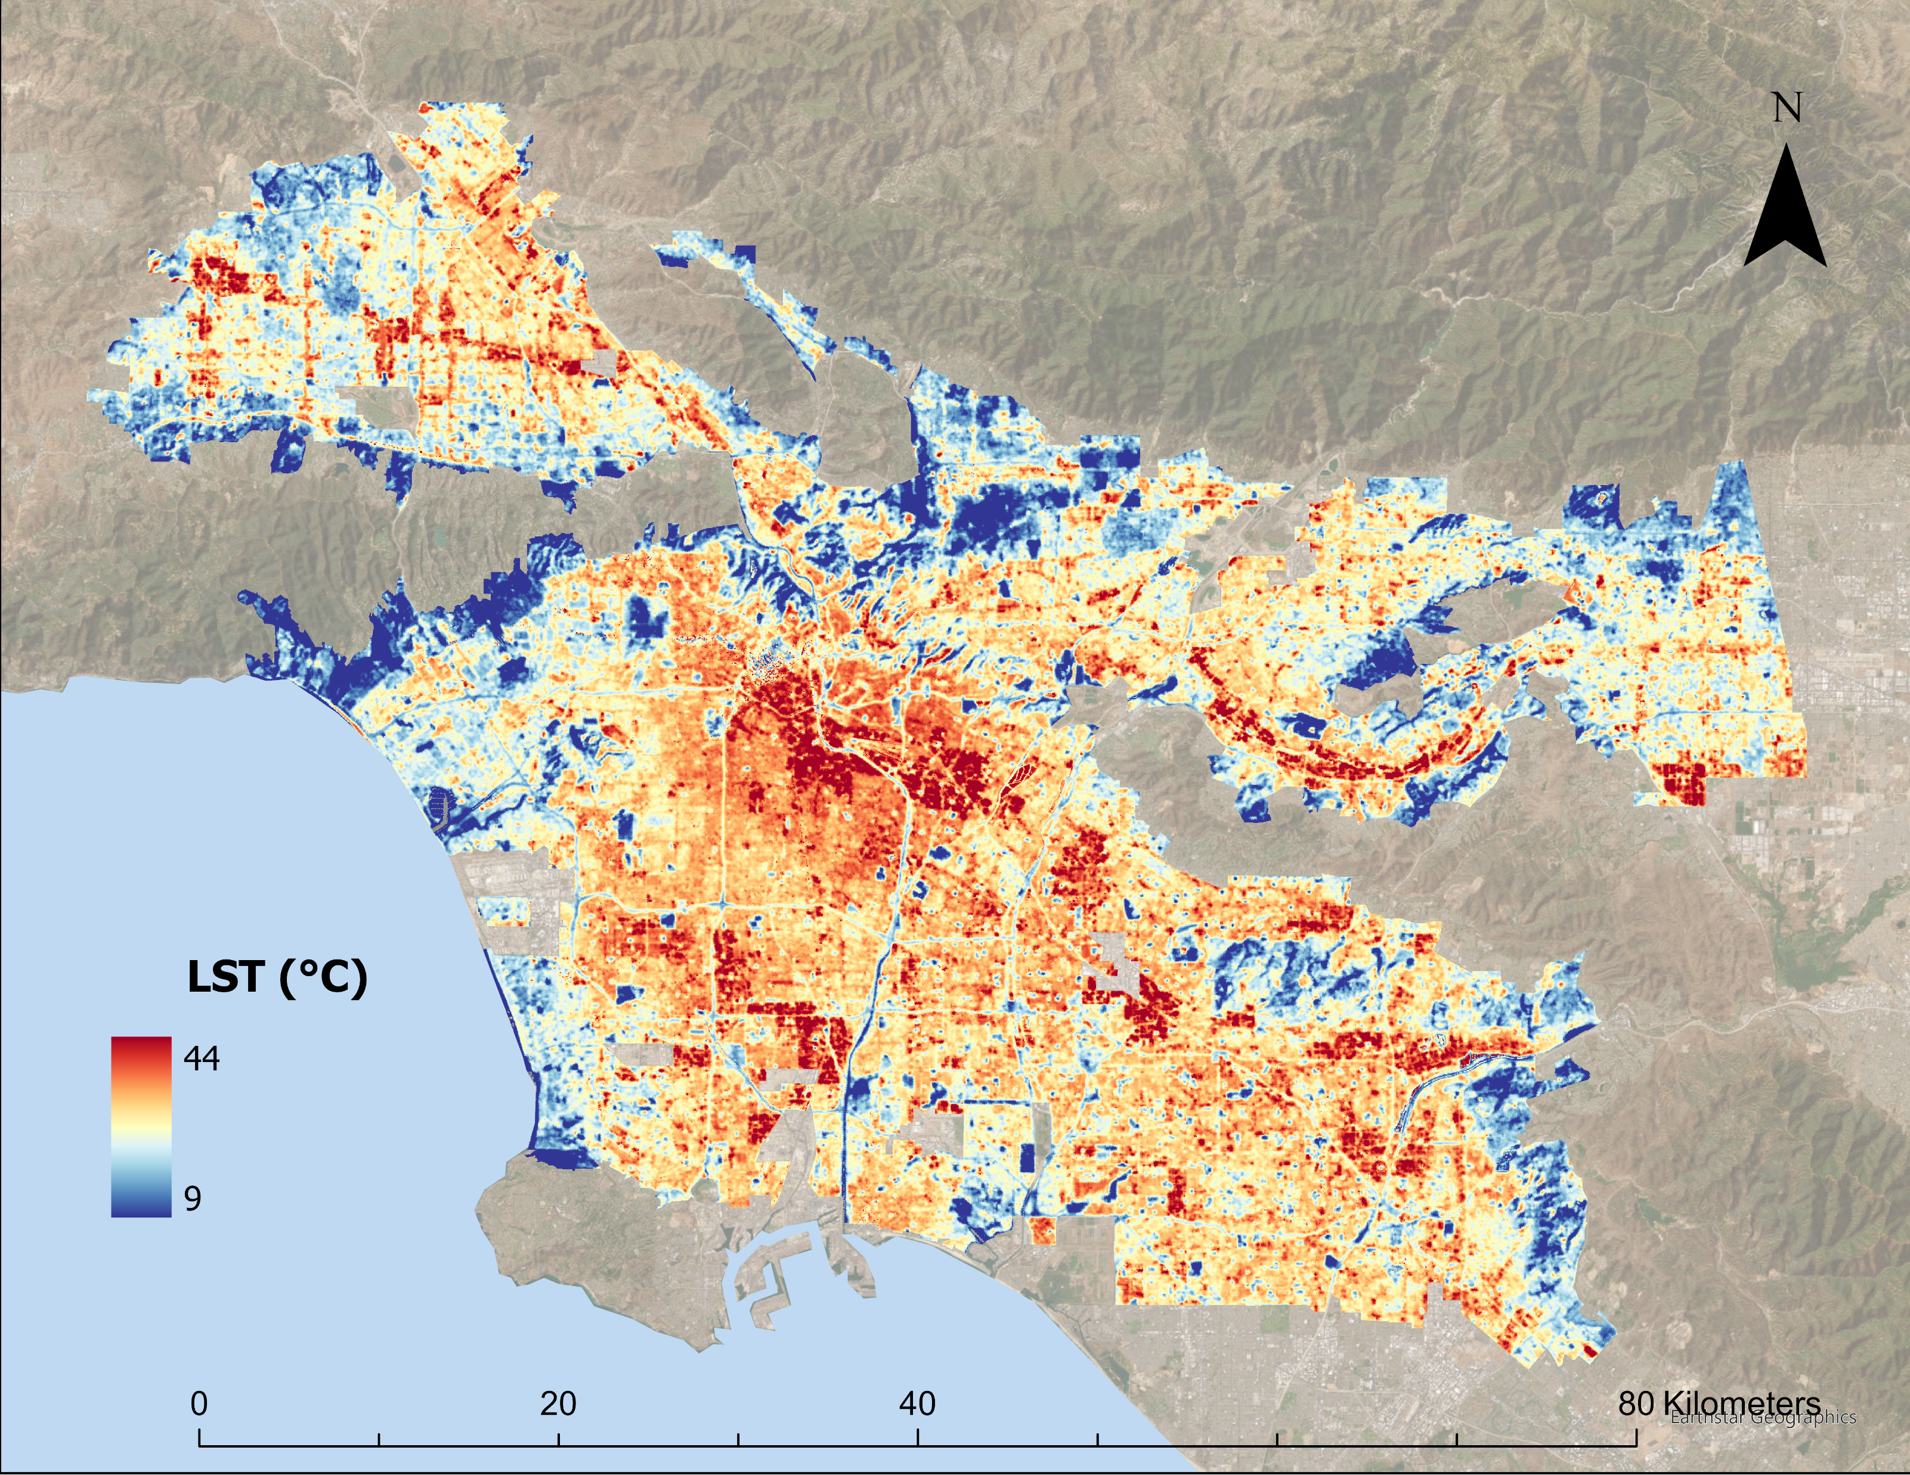
LST increased (~+0.13 °C/yr citywide) while NDVI rose, and vegetative cooling strengthened overall—masking strong neighborhood contrasts.
Drought response is coastal→inland-graded: inland tracts heat more during dry periods; near-coast areas are buffered.
Greening slows warming, and equity signals matter: income/impervious patterns help explain where heat and greenness changed most.
The classic “luxury effect” (wealthier = greener/cooler) weakened over decades, indicating shifting equity dynamics.
-
Deliverables (1–2 weeks): Landsat trend maps (NDVI, LST, cooling), drought contrasts, equity overlays, and a concise brief with recommended priority zones; includes reproducible GEE/Python code.
Decision uses: target cooling investments, design equity-aware canopy programs, and communicate drought-sensitive risk to stakeholders.

About Dion Kucera
Ph.D. | 9+ years GIS experience | Peer-reviewed publications | Landsat/Sentinel/MODIS/ArcGIS/MATLAB
I’m a remote-sensing & urban-climate scientist who turns satellite data into policy-ready maps. My work focuses on NDVI, LST, and vegetative cooling—with equity-aware diagnostics that help cities target canopy, cooling, and resilience investments.
I hold a PhD (UC Riverside, 2024) and have 9+ years’ experience analyzing Landsat/Sentinel/MDOIS time series, plus a UCR postdoc (2024–25) doing large-scale socioecological studies. I’ve published in Urban Climate (Los Angeles multi-decadal greenness/heat & equity) and lead projects spanning national and global analyses, tree-planting prioritization, urban wildfire, and invasive species mapping.
What you get: clear maps and briefs, optional web dashboards, and reproducible code (on request; GEE/Python/ArcGIS Pro) so your team can rerun and extend.
Ready to map what matters for your AOI? Contact me with your needs by e-mail.

How I work

1) Frame the decision. Define the question, AOI, and constraints (water/ROW/species).

2) Build the pipeline. Landsat/Sentinel stacks → NDVI/LST/cooling/equity; QA and drivers.

3) Deliver & hand off. Maps + 8–12-page brief + optional web map + reproducible GEE/Python code (on request).
Frequently Asked Questions
-
For long-run trends and cooling diagnostics I use Landsat (1985–present). For fine targeting I add Sentinel-2 (10 m) and, in the U.S., NAIP. Context layers include NLCD/LCMS (canopy/impervious), Census/ACS (equity), and climate/water-balance datasets (e.g., TerraClimate/SPEI). Parcel-level outputs are available where higher-resolution data support it.
I am also happy to work with other datasets such as acquired aerial imagery, MODIS, Planet, etc. -
A decision-ready package:
Maps (priority zones, NDVI/LST trends, cooling diagnostics)
A concise 8–12 page brief in plain English with methods & caveats
Exportable GeoTIFF/GeoPackage/CSV
Optional web map/dashboard
Reproducible code on request (Google Earth Engine / Python / ArcGIS Pro) so your team can rerun and extend
-
Most city pilots finish in 1–2 weeks. Pricing depends on AOI size and options (equity overlays, parcel screening, dashboard), typically from $1,950–$2,400 for a pilot. Multi-city or ongoing monitoring can be scoped after the pilot.
-
Yes—methods are sensor-standard, so I work worldwide. I can incorporate your shapefiles/parcel data and will sign an NDA if needed. If results must remain internal, deliverables are labeled “results informed internal planning.”
Let’s map what matters for you
Replies within 1 business day.
Tell me a bit about your project so I can prep before we talk:
Area of interest / location
Service you need (or your question)
Desired timeline (ASAP, <1 month, 1–3 months)
Anything you’ve already tried or datasets you have
Prefer email?