Los Angeles: 37-year NDVI, LST & Vegetative Cooling (1985–2021)
Question: How have neighborhood greenness (NDVI), land-surface temperature (LST), and plant-driven cooling changed across Greater Los Angeles—and what’s driving those changes?
What we did: Built a multi-decadal Landsat time series (1985–2021) at census-tract scale, linked to weather (TerraClimate), drought (SPEI), land cover (NLCD), elevation (SRTM), and socio-demographics to quantify trends and drought responses
Outcome: L.A. warmed ~0.13 °C/yr, NDVI increased, and vegetative cooling strengthened, with equity-relevant patterns and a coast-to-inland drought gradient that can guide investments (e.g., canopy and heat mitigation).

Research Challenge
Los Angeles is semi-arid, highly irrigated, and socio-demographically diverse. Decision-makers needed to understand where and why heat and greenness have shifted through time, including what happens during drought. The challenge was separating long-term climate and land-cover effects from year-to-year weather and surfacing actionable patterns at the tract scale across ~3,474 km² of urbanized area.
Approach
Data
Landsat ARD (4/5/7/8) for NDVI and LST (1985–2021).
TerraClimate (precipitation, temperature, radiation, etc.).
SPEIbase drought index (1–48-month scales).
NLCD (impervious %, tree canopy).
SRTM elevation; U.S. Census (income, race/ethnicity, education).
Methods
Cloud-filtered Landsat stack (215 images), tract-level aggregation, monthly series.
Trend analysis for NDVI, LST, and LST-NDVI slope (vegetative cooling).
Drought contrasts (wet vs. dry at SPEI-6), and regression/SEM to explain spatial variability (income, impervious, coast distance, canopy).
Tools
MATLAB (pre-processing, regression), ArcGIS Pro (spatial ops), Google Earth Engine (climate/elevation retrieval).
Key Findings
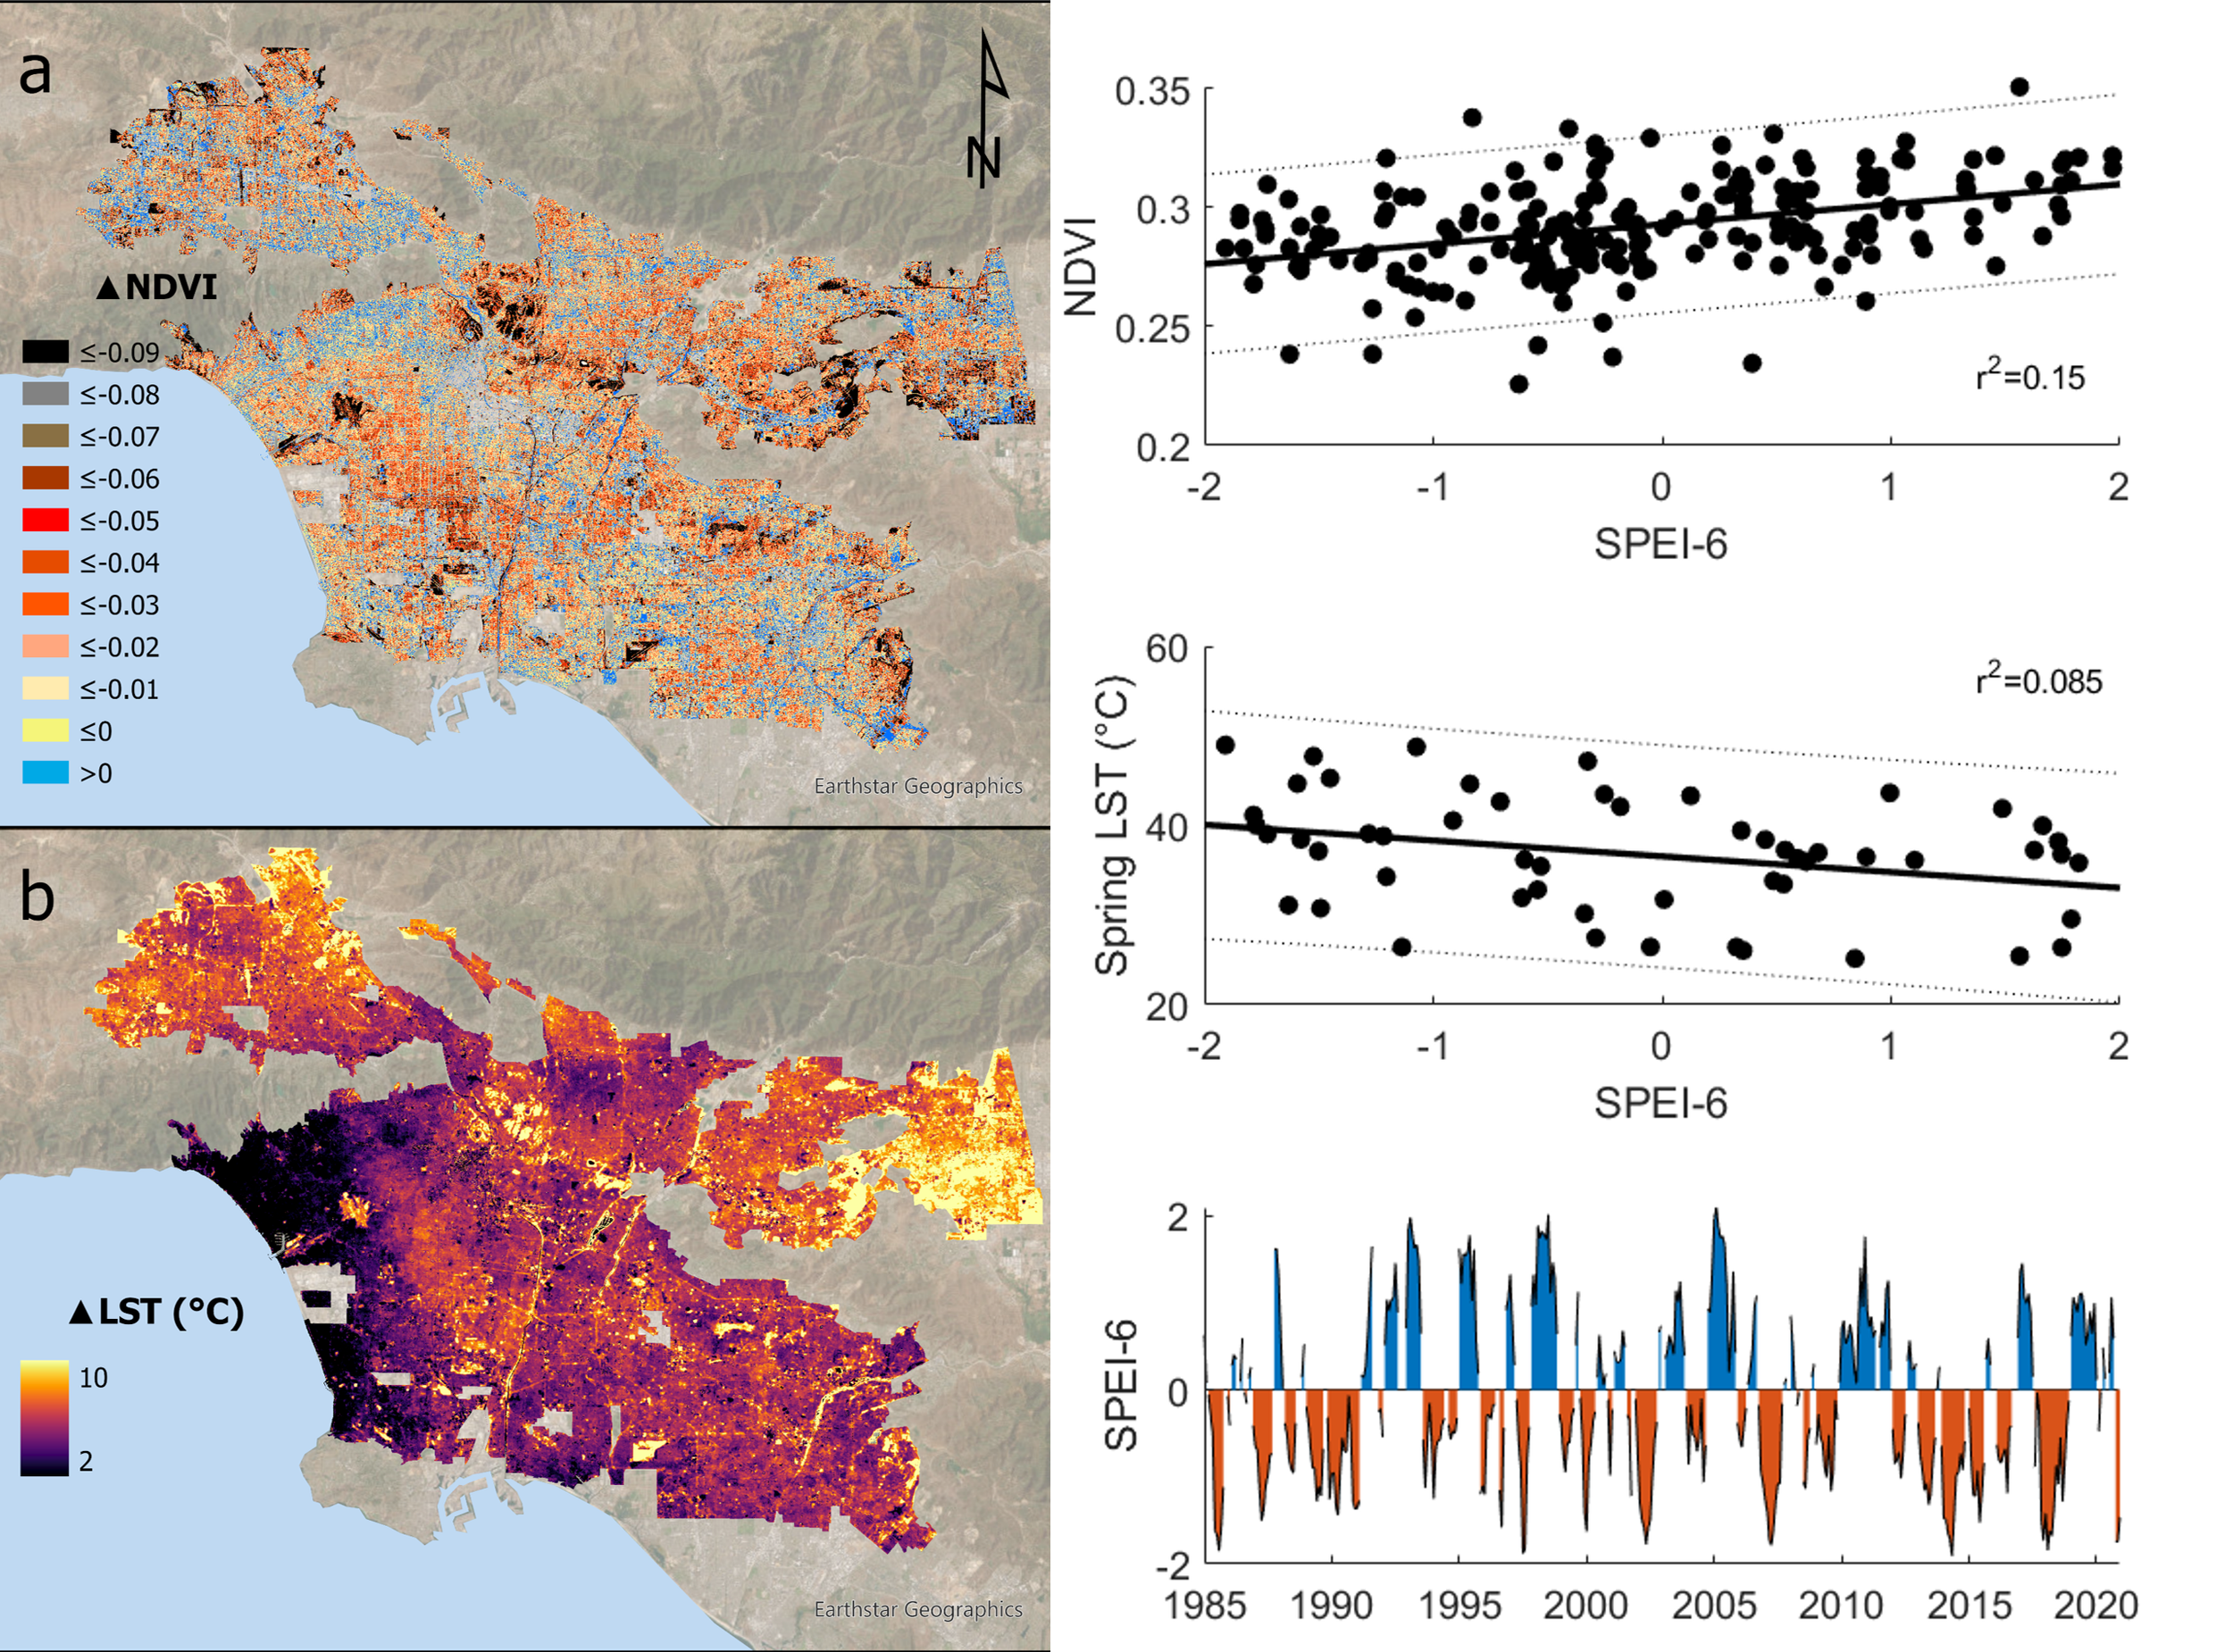
Citywide trends (1985–2021).
LST +0.13 °C/yr; NDVI +5.05×10⁻⁴/yr.
Vegetative cooling (|LST–NDVI slope|) strengthened ~0.08 °C per year; net +2.96 °C/NDVI of cooling over the record.
Weather matters: NDVI tracks 3-mo precipitation; solar radiation + air temperature explain 87% of LST variability.
During drought (SPEI-6).
NDVI −0.023; LST +4.41 °C on average; vegetative cooling +0.08 °C/NDVI.
Strong coast-to-inland gradient: ~+8 °C inland vs +2–3 °C near the coast.
Drivers & equity signals.
Income, impervious cover, and distance from coast explain spatial variability in warming and greening trends; more greening → slower warming.
Long-term “luxury effect” weakened (income’s cooling: −41%; greening: −28% from 1990→2020).


Outputs
Deliverables: tract-level trend maps (NDVI, LST, cooling), drought response maps, equity overlays, methods brief, and reproducible analysis code.
Publication: Urban Climate (2023), “Urban greenness and its cooling effects are influenced by changes in drought, physiography, and socio-demographics in Los Angeles, CA.” DOI: 10.1016/j.uclim.2023.101743.
Impact / How it’s used
Provides a defensible baseline for urban heat and greenness trends citywide, with tract-level signals to target canopy and cooling investments, especially inland.
The drought gradient (coast vs. inland) and weakening luxury effect offer policy-relevant guidance for equity-minded planting/water strategies.
Methods underpin ongoing stakeholder work (e.g., tree-priority indices, urban fire interactions) and can be re-run for any city or AOI.